6S DMAIC: Analyze
After we’ve found out that something is wrong and how to measure it, we need to find the root cause of the problem.
Analyze is this deductive part of DMAIC; it’s a deep dive into all the details of the problem. Like a murder mystery, the detective investigates all the clues to determine the real killer. Many analytical templates have been created within the engineering industry to help plot out these details and help form a cohesive story.
There’ll be a lot of push-and-pull between engineers and managers about the cost, bandwidth, and lead times required for each proposed root cause.
These analytical tools are eye-candy for upper management, because they summarize the rigorous analyze, and justifies why the selected root cause is the best choice for both the business and process.
The 5 most common analytical tools:
1. Brainstorming
2. Is-Is Not Analysis
3. The 6Ms (AKA Fishbone or Ishikawa)
4. The 5 Whys
5. Contradiction Matrix
1. Brainstorming

Once we recognize a problem, our mind immediately starts firing off possible reasons and solutions. A good start is to start writing them down and organizing them visually.
Next would be to gather the subject matter experts (SMEs), stakeholders, and witnesses to have an open discussion about the problem. Open dialogues between cross-functional groups are encouraged, as they help work through the issue and eliminate improbable or irrelevant threads. All the ideas should be recorded on a whiteboard for all participants to see, and help visualize all the ideas being presented.
The end result for this step is a list of clues. These clues help narrow the investigation towards an area that the all stakeholders will support with engineering and financial resources.
2. Is-Is Not Analysis
Another way to filter out noise is to create an “Is-Is Not” table. The method is to go through the known “Who, What, Where, When, and Why” facts of the problem state. This helps identify all of the “constant” factors that aren’t contributing towards the problem state. The factor that is good before and after the problem state “Is Not” a possible root cause.

The “Is-Is Not” is a logical refinement of the “Brainstorming” phase, and can be done simultaneously. A cross-functional group can discuss possible root causes, and then unanimously agree whether it “Is” or “Is Not” worth further investigation.
3. The 6Ms (AKA Fishbone or Ishikawa)
Another strategy is to break down the problem statement into different categories known as the “6Ms”:
- Man: Did someone make a mistake?
- Method: Were instructions themselves correct?
- Material: Were the objects poor quality?
- Machine: Did the equipment fail?
- Mother Nature: Did unexpected weather cause the problem?
- Measurement: Was the data properly recorded?
Careful thought should be put into each topic. Try to have a different perspective each time assessing the same problem statement, through the lens of each “6Ms” category. However, some categories may be entirely non-applicable to the problem statement. But that is the purpose: remove the irrelevant topics so the remaining ones may be focused on.
Typically these topics are plotted on a diagram that all leads towards the problem issue. This can be done on a whiteboard, or using programs like Visio or MindJet. Like a tree, all of the roots join together and form the main body (the problem)
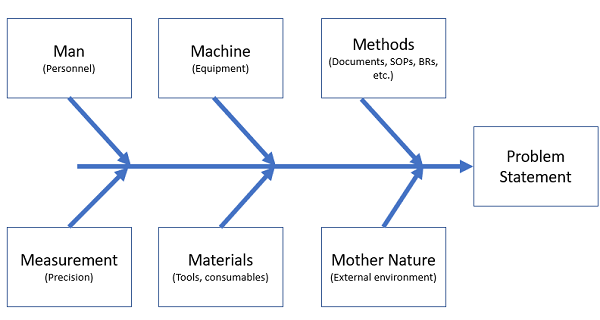
When plotted this way, the “6Ms” analysis may also be called a “Fishbone Diagram” or an “Ishikawa”. The latter was from Kaoru Ishikawa, who popularized this type of analysis in the 1960s. He used it for quality management in the shipbuilding industry. In industry, the terms: “6Ms”, “Fishbone”, and “Ishikawa” are all used interchangably, so you just learned 3 new terms!
4. The 5 Whys
This strategy involves asking a series of “Why?” questions about the problem statement. It works backwards from the problem state to the possible root cause. These questions help identify relations between the variables and conditions. The first answers should be easy at first, but get more challenging as more inquisitive “Why?” questions are asked.
Example Problem: I feel tired today
- Why do I feel tired?
- Because I don’t get enough sleep
- Why didn’t I get enough sleep?
- Because I go to bed too late, and wake up early
- Why do I go to bed so late?
- Because I want to write this blog post
- Why didn’t start I writing it sooner?
- Because I started writing too late
- Why did I start writing so late?
- Because I lost track of time and played too long!
- Possible Root Cause: I didn’t manage my time properly!
Sometimes more or less “Why?” questions are needed to arrive to the right question. Returning to investigate the area or interviewing other people might be needed, and open another chain of “Why?” questions.
5. Contradiction Matrix
The Contradiction Matrix is used after previous analytical tools had been used to generate possible root causes. After they were generated, further investigation should’ve been performed to gather more facts. The facts should be data driven, and gathered with the intent on confirming or denying the proposed root causes.
From there, the possible root causes and facts are plotted against each other in a matrix. The analysis then performed is to compare the consistency between the possible root cause with the known facts.
- If a facts support the root cause, its given an “O” (likely)
- If a fact needs more data to support the root cause, its given an “A” (maybe)
- If a fact contradicts the root cause, its given an “X” (contradiction)
- This root cause is then eliminated!

Like playing Picross or Sudoku, each row and column have to be analyzed. The cause with the majority of supporting facts should be considered for the main root cause. Unlike the previous tools, the facts are used as objective evidence to eliminate root causes.
Conclusion
Don’t expect these analytical tools to be the magic fix for every problem; they are simply tools used for filtering and processing the facts. They are used to remove irrelevant variables from the equation to see what is most impacting. Like a needle in the haystack, the needle is easier to find when we can take away hay from the pile.
These tools have some overlapping strategies, so it might be not necessary to go through every one. However, it is still good practice to plot out the progress for traceability. They are the gold standard for 6S projects, and help provide visual proof that engineering problem solving is being applied.


Comments
Post a Comment